How to Understand the Google Search Console Performance Chart

.png)
Tyler Scionti
| Published on
September 29, 2023
Google Search Console just may be the most powerful (and free) tool available to SEOs and marketers alike, but only if you use it correctly.
Most marketers use Google Search Console to measure their aggregate performance - to see if impressions or clicks are “going up and to the right” and to pull their top 10 queries.

Google Search Console is so much more powerful than that though. But let’s face it, it can be intimidating.
Google’s UI for their different analytics tools is far from fantastic (and that’s being generous), but then you have foreign terms to learn (like impressions or position), multi-colored charts, and I’m not even getting to the hard stuff like filters and the tables below (or the data mismatches due to data thresholding…more on that later).
If you find your eyes glazing over when you try to read a Google Search Console chart, then this guide is for you. I’m going to walk you through how to use Google Search Console to better understand how your SEO strategy is performing, and my favorite reports to check with it.
Key terms in the Google Search Console Performance Report
Before diving into all of the reports you can whip up, let’s review a few key terms to be aware of. These are the essential terms to know when using Google Search Console:
- Impressions
- Clicks
- Position
- Filters
Impressions
Impressions measure the number of times a search results page with your website has been seen. This does not always mean your website was seen though. For instance, if you rank at the bottom of page 1 for a keyword, then any time someone Googles that keyword you will earn an impression whether or not they scroll down to actually see your page. This is a key distinction that many new users to Google Search Console miss.
Clicks
Clicks measure the number of times your website has been clicked on from search results. This is the most straightforward Google Search Console metric, except for one common issue websites run into: data thresholding - we’ll get to that later when we dive into the page and query tables.
Position
Position measures the average position across all keywords for the website in that timeframe. This average is weighted, so queries with more impressions will count for more. Learn more about these three metrics in our guide to impressions, clicks, and position in Google Search Console.
Filters
You have the option to filter the data to dig into different aspects of your performance and refine your SEO strategy. You can filter by:
- Date: Set date ranges to refine what you get in the chart
- Query: Filter by exact keywords or keywords that include your filter
- Page: Filter by exact pages or pages that include your filter
- Country: Filter and compare performance by country
- Device: Filter and compare performance by device
- Search appearance: Filter and compare performance by search appearance. For example, organic results vs image results.
How to interpret a Google Search Console chart
We’re trained to look at charts that go “up and to the right” as good and “down and to the right” as bad, but Google Search Console is not so simple.
Here’s the typical Google Search Console chart:

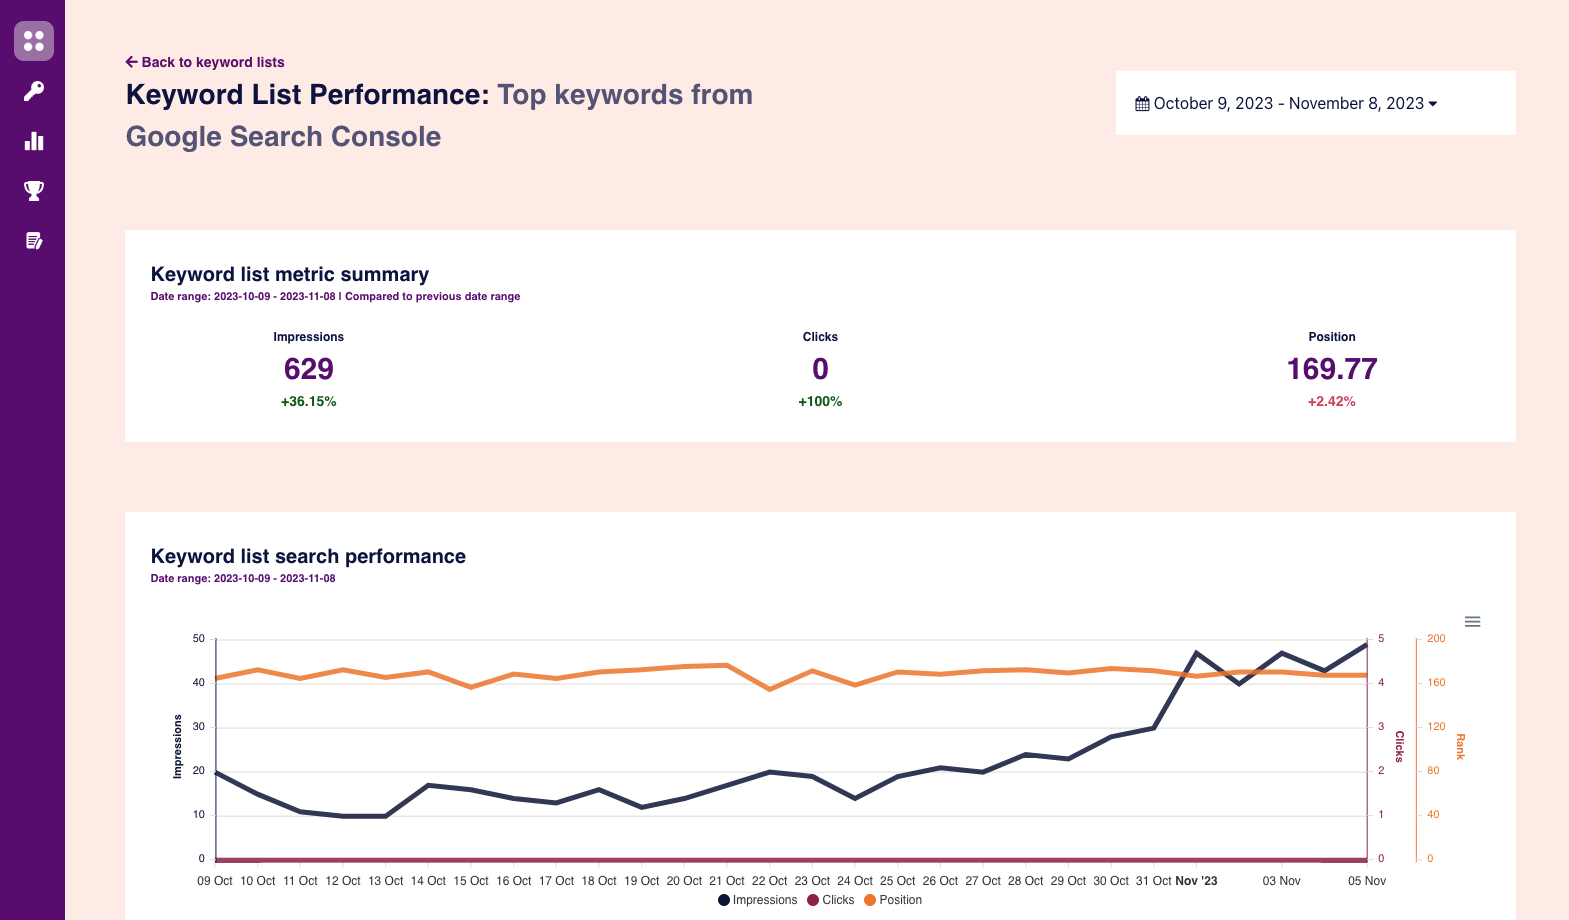
And here’s a screenshot from Centori, our all-in-one SEO platform that integrates with Google Search Console. Centori backs up and stores your Google Search Console data allowing you to generate custom reports (and have a longer-term backup than Google Search Console allows):

What do we make of this chart? Remember:
- Impressions measure how often your website appears on a search results page
- Clicks measure how often your website is clicked on from search results
- Position measures your average position in search results
The higher your impressions and clicks the more often your website is appearing and getting clicked on in search results. The lower your position the higher your website ranks in search results (the closer you are to the top of search results).
Impressions and position tend to move in opposite directions, which intuitively makes sense: the lower your position (higher you rank) the more often you will be seen in search results.
Now let's look at a few common scenarios you might see in your data and what they could mean.
Impressions are going up but clicks are not
This means that your website is appearing more often in search results but not being clicked. It could be that a few content pieces are ranking higher (perhaps on page 2 or the bottom of page 1) but searchers are not clicking on them. Try optimizing the title for click-throughs, or look deeper into the queries/pages that had the biggest jump in impressions.
Impressions are going down but clicks are going up
This could mean that a few pages on your website that earned impressions but not clicks have dropped in position, while other pages on your website may be ranking higher and earning more clicks as a result but not many more impressions.
Impressions and clicks are going down but position remains the same
I see this a lot with seasonal websites. If your impressions and clicks are down, but your average position (especially for top queries) remains the same then it could be seasonality causing people to search less in your industry.
Impressions are going up and position is as well
This is common for newer websites or websites that expand into new niches. Impressions and position usually move in opposite directions - the higher your position the fewer times you will be seen in search results. For new websites, you will not have much position data outside the keywords you rank for (like your brand name). As you publish content and your website ages, you will rank for more keywords and likely not highly for all of them. This will cause your impressions to rise, but your position will increase as well.
There are countless more scenarios than these, but this gives you an idea of how to dig into and rationalize the movements you see in your data.
Don’t stop there, drill down into performance for groups of pages and keywords
Now reporting on your aggregate performance can be informative as to the overall health and strength of your website, but why stop there?
If you have an older website with lots of content, this could be pulling data for thousands of keywords which starts to become much less meaningful, especially if you run targeted content campaigns for a strategy.
That’s why Centori’s ability to report on search performance for a single page, keyword, or group of pages and group of keywords is one of my favorite features we offer. You can save as many keywords as you like in our flexible lists and quickly generate a report.
Report on a topic cluster, keywords targeting a persona, or even compare different keyword modifiers - all in seconds!
Up next is how to interpret the Google Search Console tables.
How to interpret the Google Search Console queries table
The queries table in Google Search Console will give you a breakdown of your search performance by query (keyword).
This is a fantastic way to see the keywords your website ranks for (and get a sense of what keywords your customers use that you might not have considered before). In the table you will get a series of columns showing you the:
- Keyword
- Impressions
- Clicks
- Position (this will show the average position for this keyword across all pages that rank for it)
Here’s a shot from Centori’s Google Search Console dashboard to show how this data looks:

This is one of my favorite ways to:
- Check my top-performing keywords
- Spot new keywords I am ranking for
- Review keywords I rank for by page
How to interpret the Google Search Console pages table
The pages table in Google Search Console will give you a breakdown of your search performance by page.
This is a handy way to get a better sense of how your content is performing (and which pages may be underperforming). In the table you will get a series of columns showing you the:
- Page
- Impressions
- Clicks
- Position (this will show the average position for this page across all keywords it ranks for)
Here’s a shot from Centori’s Google Search Console dashboard to show how this data looks:

I love to check out my page performance table to see:
- Which pages are bringing in most of the traffic (or impressions)
- Which pages have high impressions but low clicks (and therefore need to be optimized)
- Which pages are getting little to no impressions from Google searches - these are usually good candidates to prune
Why do clicks by query and clicks by page not match up?
If you pay very close attention to your clicks by query and clicks by page table, you will note that they do not match up exactly.
For newer websites with limited data, I’ve seen these figures be far off from each other, which presents a question: why?
It’s not a bug or error, this discrepancy is intentional on Google’s part. As a software company, Google needs to uphold certain data privacy standards and that means making some data (like the specific keyword someone used) private. Google can freely give a total breakdown of clicks by page but will hold back a percentage (sometimes as much as 10 - 20%) of clicks when broken down by keyword.
Because of this, when Centori backs up your Google Search Console performance, we group clicks and impressions under an “unknown query” row to give you a sense of clicks for anonymous keywords:

There’s an easier way to master Google Search Console
Google Search Console is an incredibly powerful tool - but at the same time even if you have mastered the trends, you might still be overwhelmed.
What if I told you there was an easier way to master Google Search Console? And no, it does not require getting certified or becoming a business analyst.
In fact, it's a sort of "cheat code" to understanding your data - all you need to do is sign up for Centori.
The Centori SEO platform integrates with Google Search Console to provide you with all of your data for your website AND combines that with AI-powered insights and analysis to help you understand your performance and prioritize your next steps. We initially founded Centori as an SEO coaching company, but these AI-powered insights bring a new level of coaching and expertise to your data that you cannot find anywhere else.
At $39/month (and a 30-day money-back guarantee) it's a fantastic way to get ahead of your competitors on Google.
.png)


